Lets talk strategy
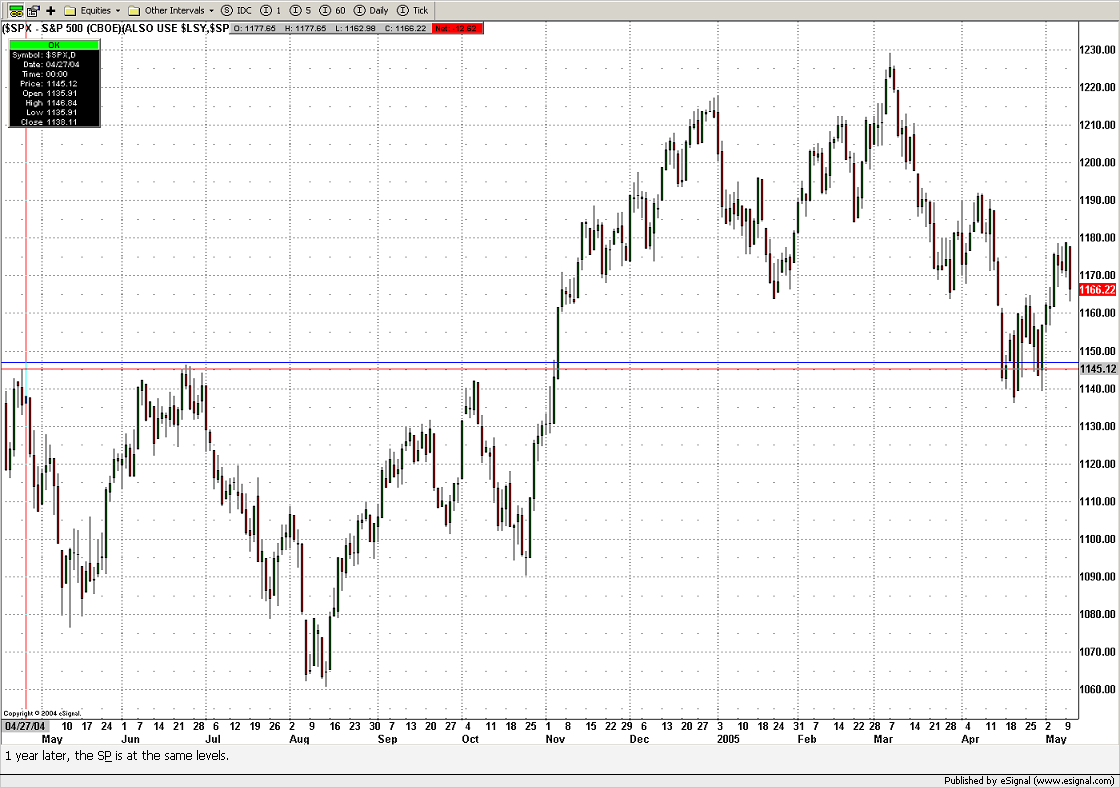
The S&P is currently at the same levels it was 1 year ago. I took out my pen and paper and did a little counting to see who has been running the trading days for the past year. One way to see who runs the market is to find the midpoint (high + low / 2) of a daily range. A close below the midpoint indicates the bears where in control by the close, a close above indicates the bulls controlled the session. It turns out that 44% of the trading days for past year were controlled by the bears. If done since the start of 2005, 48% of trading days were controlled by bears. What does this mean? Forces between the bulls and bears have been balanced in the past year to date.
The forward earnings for the S&P 500 is $74 per share according to Thompson. S&P closed today at 1166.22. The yield for the S&P comes out to 6.3% (74/1166.22). A good indicator of where interest rates will be 1 year from now is the 10 year treasury which currently yields 4.2%. This means the S&P has a 2.2% yield premium (6.3 - 4.2). In the past 25 years, every time the S&P yielded greater then 1% over the 10 year treasury, the S&P has showed a positive return in the next 12 months.
This is a market that over the next 12 months favors the patient bull. I think the best way to take advantage of the highly impatient bearish sentiment we find is to sell puts. Option premiums on puts are currently high. Selling puts allows you to collect that premium while the trendless market erodes the time premium from those who bought it from you. In a worst case senario the stock goes down into the money and you end up owning the stock. Given that the market is bullish bias for the next 12 months owning stock is not bad. GOOG & SHLD are both good stocks this strategy can be applied to.
posted by Financial Planner @ 9:41 PM
1 comments
![]()
![]()

1 Comments:
home equity loans refinance credit
Post a Comment
<< Home